Augmented Reality with Power BI
Have you considered connecting something in the real world, like a product or a hard copy report, directly to a business intelligence digital information?
This can be a funny way for your company to become more data-savvy and to improve the engagement towards company's performance.
In this post I will guide you throughout two simple ways to link the real world with your Power BI data, using augmented reality.
If you are new to Power BI, please read our previous post here.
Scenario
Let’s suppose you work in the sales department, responsible for the monthly sales report, containing the performance by sales person, sales team and for the whole business.
This report is currently distributed as a hard copy and emailed as a PDF.
You have just started using Power BI and want to allow your colleagues to easily transit from the hard copy to the new interactive and real-time report.
Your objectives are:
1. Allow people with the hard copy report to easily see the overall sales performance of the company and to navigate to the interactive version of the report.
2. At the entrance of the sales department, allow people to scan a code and see the sales performance by month.
Step 1: Load some Sample Data
Before jumping into the real word, lets first load a sample Power BI report and dashboard.
1. Open Power BI Service: https://powerbi.microsoft.com/
2. Sign In or Sign Up for a free or trial account.
3. In the bottom left corner click on “Get Data”.

4. On the Get Data, click on “Samples”.

5. Select “Retail Analysis Sample” to open a description of that sample. Then choose “Connect”.
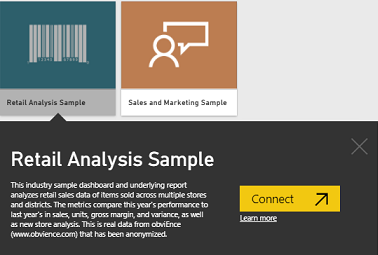
Power BI will then import the content pack and add a new dashboard, report, and dataset to your workspace.
Step 2: Generate QR codes
It is time to generate the QR codes you will attach to the sales report and to the entrance of the sales department.
1. In the left menu, expand “My Workspace”.
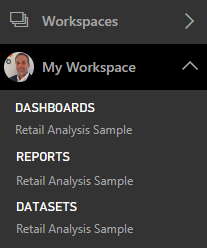
2. Open the dashboard “Retail Analysis Sample”.
3. Locate the tile “This Year’s Sales | New & Existing Stores”, click on the ellipsis (...) in the top-right corner and select “Open in focus mode”.
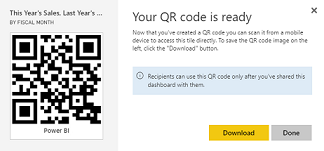
4. Click on the ellipsis (...) in the top-right corner and select “Generate QR Code”.
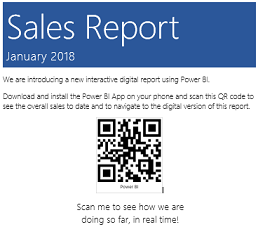
5. Download the image with your code.
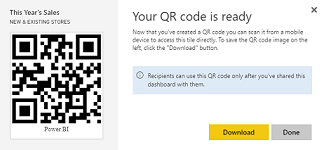
6. Add the code to the cover page of your report.
7. Go back to the dashboard.
8. Repeat the steps above for the tile “This Year's Sales, Last Year's Sales | by Fiscal Month”.
9. Download your code to add to the entrance of the sales department.
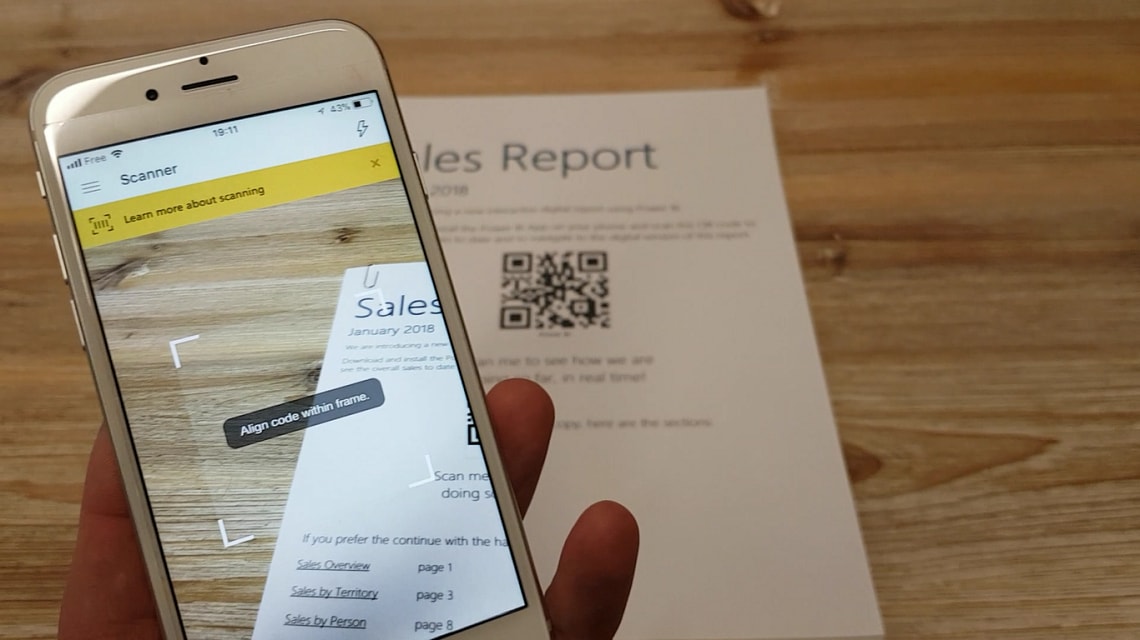
Step 3: Lets test it.
You have just added the first QR Code to the cover page of your hard copy report and the second QR Code to the entrance of the sales department.
Check the video with the results using the iOS Power BI App.
Using a product barcode
You can also allow people to scan a product barcode and get a report already filtered by the product.
For more information on that, please read this post.
Diego Eick Moreira
Founder & Microsoft Specialist at codeHB